Predictive Forecast Chart
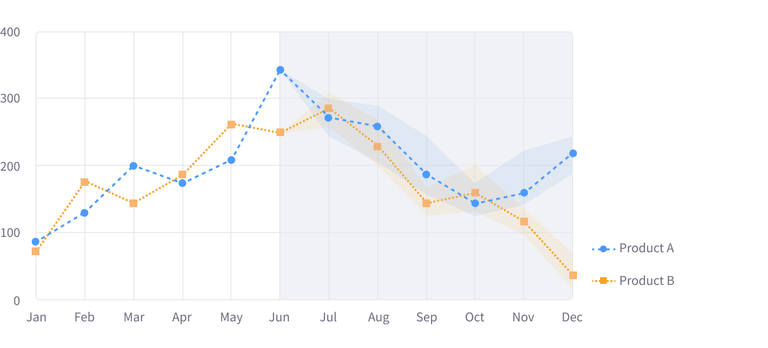
The Predictive forecasting chart uses customer data to predict future data with a declared margin of error.
This chart contains three key parts: the past, the present, and the future. The past is represented with a line that goes up to the present. The present, or current date, is the point where the line starts having a shaded background. Finally, the future, or prediction, is differentiated with a shaded background.
States
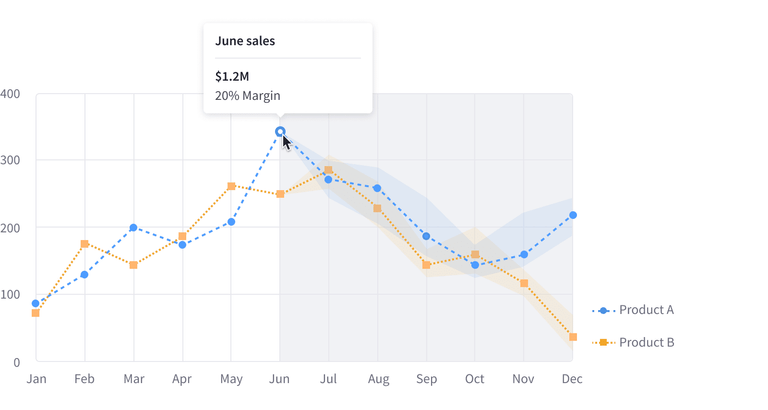
Single point interaction
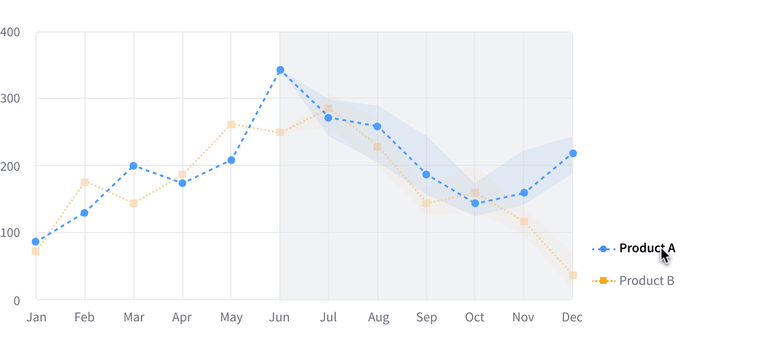
Legend item interaction
Menu


