Using Contingency Tables by Miriam Manso on April 21, 2021
4 Min Read

Crosstabs (or contingency table) are possibly the most widely used statistical technique in data analysis. It’s a bivariate analysis technique that relates two or more variables and tries to find out if there is a relationship between them.
Variables are the characteristics or properties of an object or phenomenon. They can be qualitative or quantitative, and acquire different values. For example, for an assessment test: pass or fail; right-handed or left-handed people...(these characteristics are qualitative).
Variables can be independent or dependent. An independent variable is one that the investigator can control and modify for a given experiment. The dependent variable’s outcome will depend on how the independent variable is modified. It is very important to identify them well in our investigation because they will be located in different places on our contingency table.
The goal of using the crosstab as a statistical technique is to find out whether the two variables (dependent and independent) are correlated to each other or not. In other words, to test if the independent variable is influencing the dependent variable, or not. In order to find this out, we will use the percentage distribution.
Example of Usage
In our latest research study, the Lexicon team requested a test of the Dual Listbox component with the following research question: Does the order of the boxes influence the usability of the component? That is, which side would it be better to place the box of the items available to select, and on which side the box of the selected items?
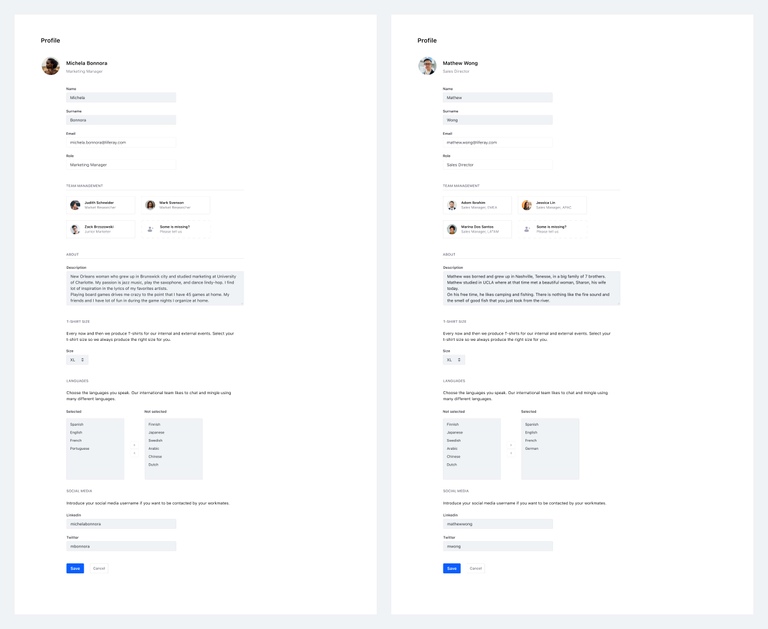
Dual Listbox Version 1 (left) and Version 2 (right)
The main idea of the test was to propose a series of tasks to the participants related to the use of the Dual Listbox, observe their experience, and finally ask which version of the component they felt most comfortable with.
Test environment. Figma interactive mockups. Version 1 - environment A (left), Version 2 -environment B (right)
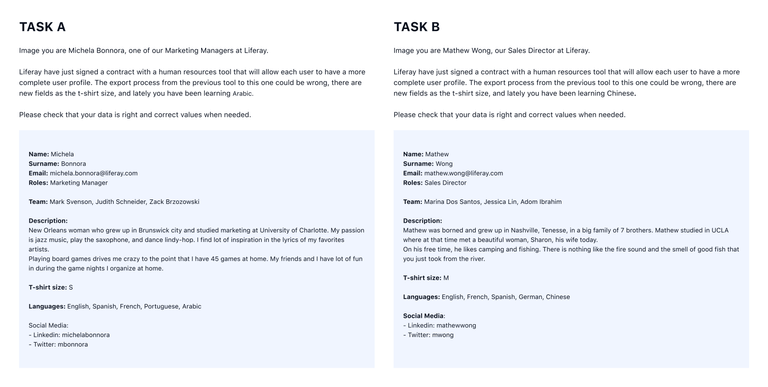
Test tasks. Environment A (left), environment B (right)
We selected the largest sample we had (65) of non-technical participants and non-regular users of Liferay DXP. This sample was randomized and split in two groups, one starting in test environment A (box order Selected - Not Selected) then continuing to B, and the other group starting in test environment B (box order Not Selected - Selected) then continuing to A.
In this study, we have two variables:
- Independent variable, the order in which the different versions are shown to the participants (environment A or B)
- Dependent variable, the choice that the participants make about the most comfortable environment for them.
We also formulated our null hypothesis: the order in which the test environments are displayed does not affect the choice of the participants.
As we reached the halfway point of the experiment, 30 participants approximately, the data collected caught our attention. It seemed that the independent variable (the order of the version in which they began to do the test) was affecting the dependent variable (the choice of the most usable version for the participants).
Given this situation, we decided to pause the experiment in order to analyze the data. This is the moment where the contingency table comes into play. We put the data we had in the following table and we tried to observe if a relationship between variables was occurring.
Crosstab Dual Listbox User Testing
How do we analyze the data in the table?
The first thing we observe is that 42.85% of the participants so far had chosen version A compared to 57.14% who chose version B. As we can see, there was no significant difference.
But let's see what happens if we analyze in depth.
To understand what the data is telling us in this table, we must compare the difference in percentage of by rows. A greater difference between percentages in the cells in the same row indicates a stronger relationship between variables. . That is, one variable would explain the other (in our case, the order in which the versions are shown would explain the choice that the participants make).
So, if we look at the first row we see that 42.85% of participants chose version A. This percentage is higher (71.42%) in the people who started the test for the A version and much lower (14.28%) in the people who started the test by version B.
We observe that the difference between percentages is quite large.
Now we analyze the row below. The 57.14% of the participant chose version B. This percentage is higher (85.71%) in the people who started the test for the B version and much lower (28.57%) in the people who started the test in version A.
One more time the difference between percentages is quite large.
As we can see, the independent variable, which is the order in which the prototypes are shown to the participants, is influencing the dependent variable, which is the choice of the participants.
There are a series of statistics that help to solve the concern of knowing if there is an association between variables and how strong it is. These statistics also allow us to know through the data whether or not we can refute the null hypothesis. Our null hypothesis is that "the order in which we display the mokups does not affect the choice of one version or another".
Let's see what the data says. For that, we are going to start using the nonparametric Chi-Square Test of Independence than is denoted χ2, and is computed as:

Given a significance level α = 0.10 and the degrees of freedom df = 1, if we apply all these data, we will observe that in order to refute the null hypothesis, the p-value (x2) has to be less than 10% (0.10). Our p-value is 0.043.
So, it seems that we can disprove the null hypothesis: the order in which the test environments are displayed does not affect the choice of the participants. The data shows that the choice of participants is associated with the order in which the versions are shown.
Now what about the first question we asked: "Does the order of the boxes affect usability?" The previous data seem to show that the perception of greater usability in one order or another is not determined by causes beyond the component itself. Their choice was determined by external causes (the order in which the two different environments were displayed).
During the tests, it was observed that there were no usability problems in any of the cases, regardless of the order of the boxes. In addition, the participants with an acquired mental model based on the daily use of tools that use the component in the order unselected - selected (environment B), chose the opposite (environment A) as more usable, when A was shown as the first option. Their mental model didn’t affect their interaction when the component is displayed in the reverse order.
Based on all the data extracted, both quantitative and qualitative, we can finally answer the question we asked at the beginning. The answer is: the order of the boxes does not seem to affect the usability of the component.
Conclusions
Although we researchers love to get to the end of the process and complete it as orthodoxly as possible, sometimes when research is done in a business environment rather than an academic one, time is a value to be taken into account. So sometimes it is good to stop in the middle of a research process, observe the data and assess how we should proceed or in some cases, if it is necessary to do so. The sooner we can obtain valid and reliable data before we can give a recommendation to the teams so that we are saving time and resources.


